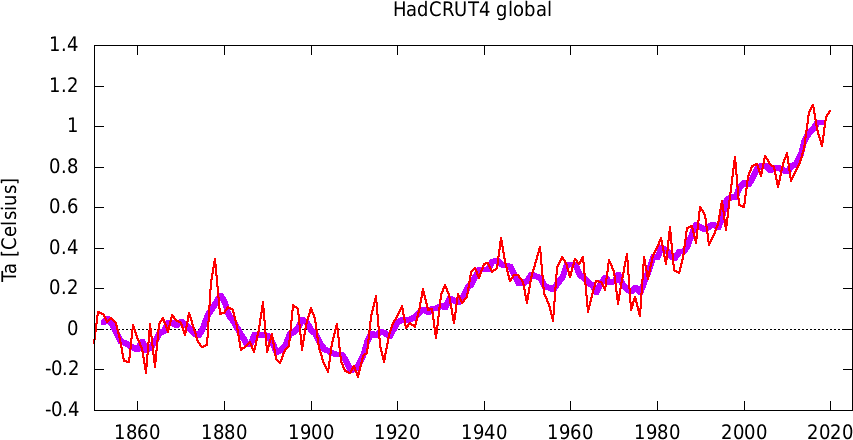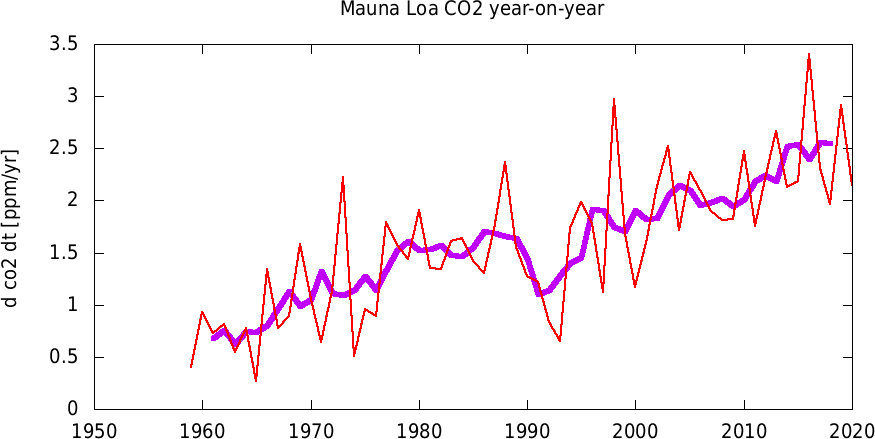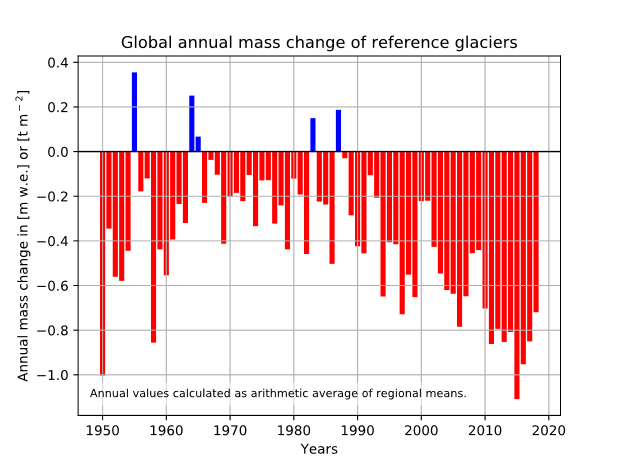
Red: values per year (Jan-Dec); violet: 5-year running averages
Anomalies are relative to 1955-2005

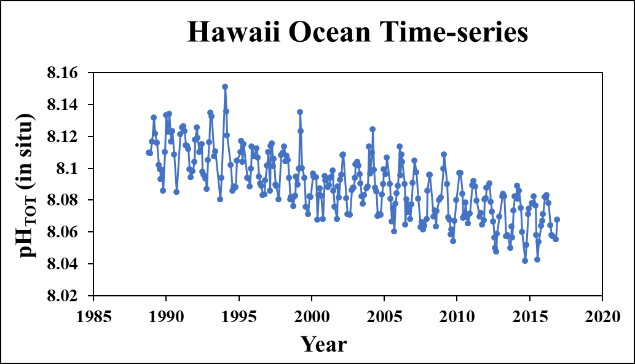
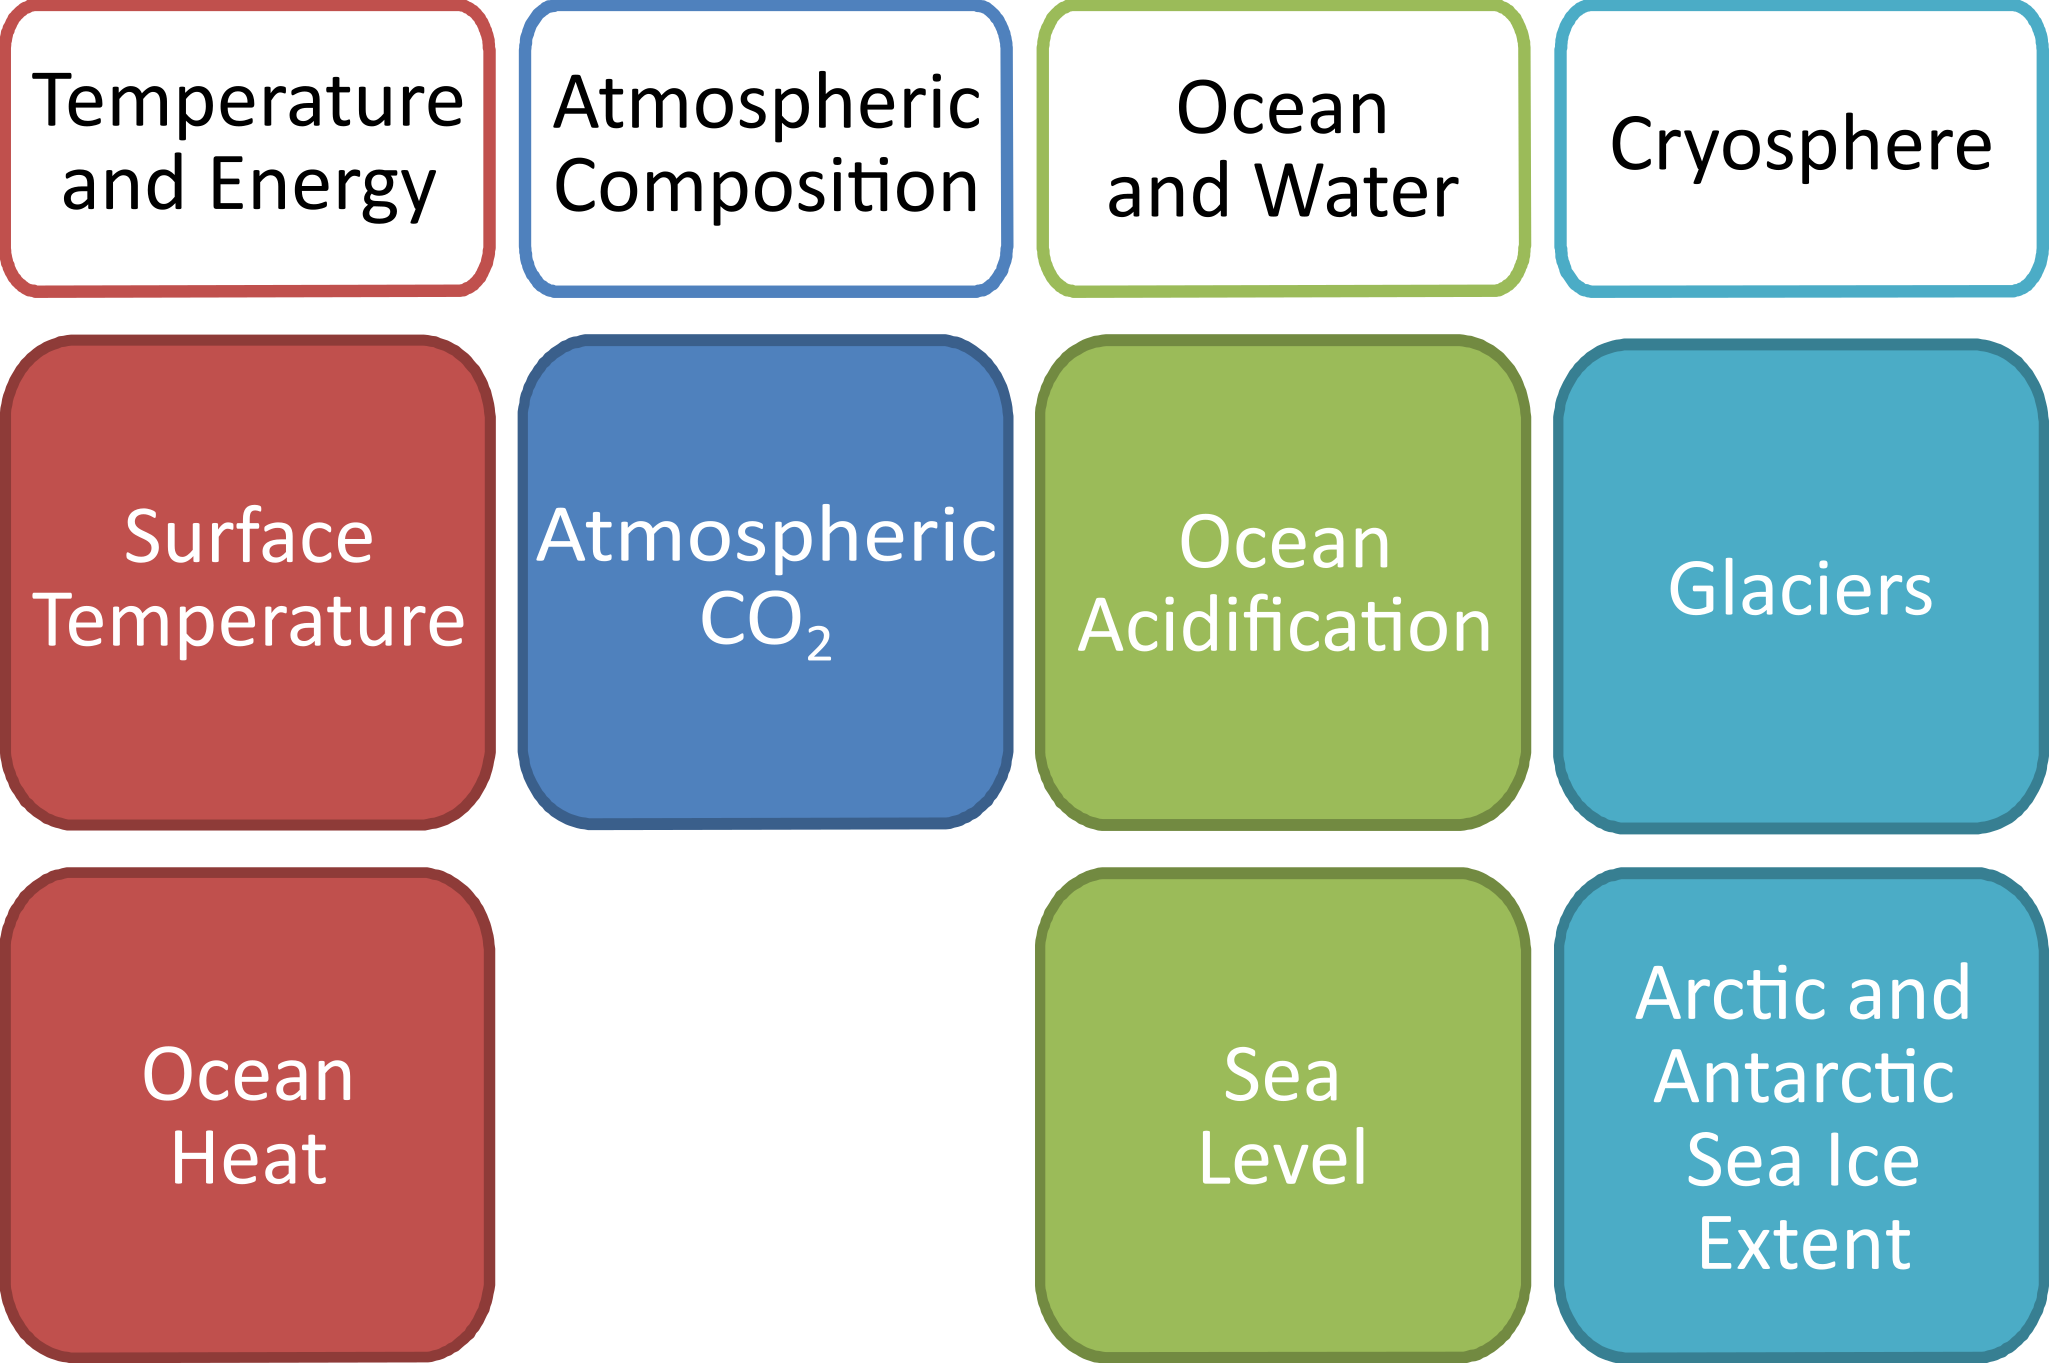 WMO uses a list of 7 state-of-the-climate indicators that are based on the 54 Global Climate Observing System (GCOS) Essential Climate Variables, including surface temperature, ocean heat content, atmospheric carbon dioxide (CO2 ), ocean acidification, sea level, glacier, and Arctic & Antarctic sea ice extent. Additional indicators are usually assessed to allow a more detailed picture of the changes in the respective domain.
Red: values per year (Jan-Dec); violet: 5-year running averages
Anomalies are relative to 1955-2005
Red: values per year (Jan-Dec); violet: 5-year running averages
Precipitation percentile (Source: GPCC)
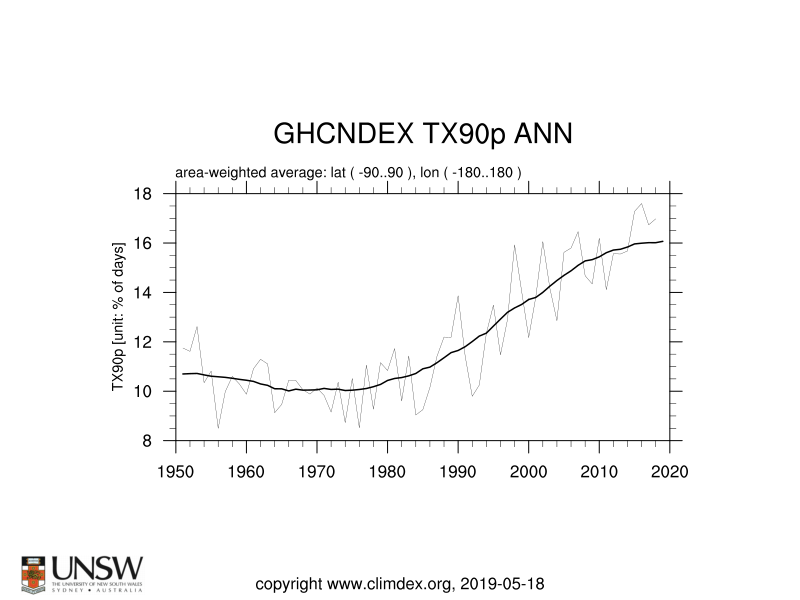
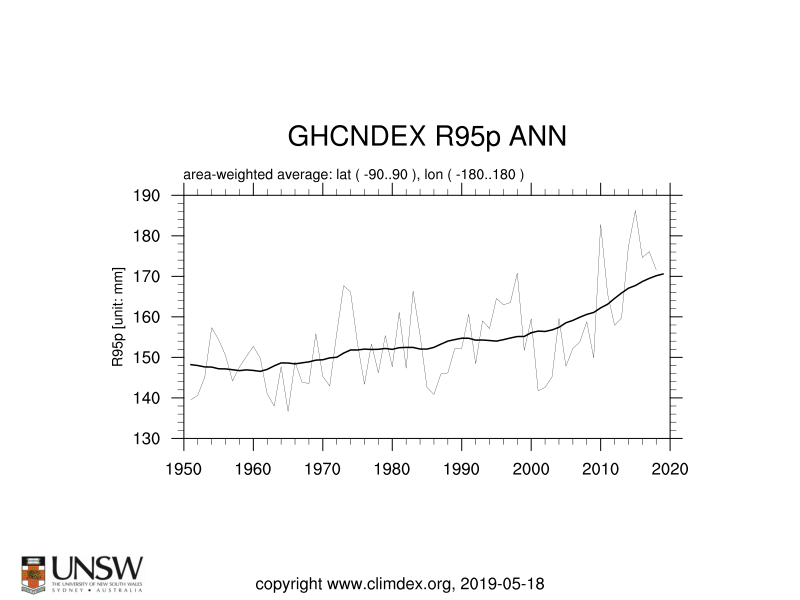
Reference period: 1951-2010
Global mean temperature anomalies
Red: values per year (Jan-Dec); violet: 5-year running averages
Anomalies are relative to 1850-1900
Warm days (TX90p) and Very wet days (R95p)
Red: values per year (Jan-Dec); violet: 5-year running averages
Red: values per year (Jan-Dec); violet: 5-year running averages
Sea Ice extent
Red: values per year (Jan-Dec); violet: 5-year running averages